RHCSA Rapid Track
System administrators optimize the performance of a system by adjusting device settings based on various use case workloads. The tuned daemon applies tuning adjustments both statically and dynamically by using tuning profiles that reflect particular workload requirements.
The tuned daemon applies system settings when a service starts or on selecting a new tuning profile. Static tuning configures predefined kernel parameters in profiles that the tuned daemon applies at boot. With static tuning, the tuned daemon sets kernel parameters for overall performance expectations, without adjusting these parameters as activity levels change.
With dynamic tuning, the tuned daemon monitors system activity and adjusts settings according to runtime behavior changes. Dynamic tuning continuously adjusts tuning to fit the current workload, starting with the initial declared settings in your selected tuning profile.
For example, storage devices experience high use during startup and login, but have minimal activity when user workloads consist of using web browsers and email clients. Similarly, CPU and network devices experience activity increases during peak usage throughout a workday. The tuned daemon monitors the activity of these components, and adjusts parameter settings to maximize performance during high-activity times and to reduce settings during low activity. Predefined tuning profiles provide performance parameters that the tuned daemon uses.
To monitor and adjust parameter settings, the tuned daemon uses modules called monitor and tuning plug-ins, respectively.
Monitor plug-ins analyze the system and obtain information from it, so the tuning plug-ins use this information for dynamic tuning. At this moment, the tuned daemon ships with three monitor plug-ins:
disk: Monitors the disk load based on the number of I/O operations for every disk device.net: Monitors the network load based on the number of transferred packets per network card.load: Monitors the CPU load for every CPU.
Tuning plug-ins tune the individual subsystems. They use the data from the monitor plug-ins and the performance parameters from the predefined tuning profiles. Among others, the tuned daemon ships with the following tuning plug-ins:
disk: Sets different disk parameters, for example, the disk scheduler, the spin-down timeout, or the advanced power management.net: Configures the interface speed and the Wake-on-LAN (WoL) functionality.cpu: Sets different CPU parameters, for example, the CPU governor or the latency.
By default, dynamic tuning is disabled. You can enable it by setting the dynamic_tuning variable to 1 in the /etc/tuned/tuned-main.conf configuration file. If you enable dynamic tuning, then the tuned daemon periodically monitors the system and adjusts the tuning settings to runtime behavior changes. You can set the time in seconds between updates by using the update_interval variable in the /etc/tuned/tuned-main.conf configuration file.
[root@host ~]$ cat /etc/tuned/tuned-main.conf
...output omitted...
# Dynamicaly tune devices, if disabled only static tuning will be used.
dynamic_tuning = 1
...output omitted...
# Update interval for dynamic tunings (in seconds).
# It must be multiply of the sleep_interval.
update_interval = 10
...output omitted...You can install and enable the tuned package by using the following commands:
[root@host ~]$dnf install tuned...output omitted... [root@host ~]$systemctl enable --now tunedCreated symlink /etc/systemd/system/multi-user.target.wants/tuned.service → /usr/lib/systemd/system/tuned.service.
The tuned application provides profiles in the following categories:
Power-saving profiles
Performance-boosting profiles
The performance-boosting profiles include profiles that focus on the following aspects:
Low latency for storage and network
High throughput for storage and network
Virtual machine performance
Virtualization host performance
The next table shows a list of the tuning profiles that are distributed with Red Hat Enterprise Linux 9:
Table 6.3. Tuning Profiles Distributed with Red Hat Enterprise Linux 9
| Tuned Profile | Purpose |
|---|---|
balanced
| Ideal for systems that require a compromise between power saving and performance. |
powersave
| Tunes the system for maximum power saving. |
throughput-performance
| Tunes the system for maximum throughput. |
accelerator-performance
| Tunes the same as throughput-performance, and also reduces the latency to less than 100 μs. |
latency-performance
| Ideal for server systems that require low latency at the expense of power consumption. |
network-throughput
| Derived from the throughput-performance profile.
Additional network tuning parameters are applied for maximum network throughput. |
network-latency
| Derived from the latency-performance profile.
Enables additional network tuning parameters to provide low network latency. |
desktop
| Derived from the balanced profile.
Provides faster response of interactive applications. |
hpc-compute
| Derived from the latency-performance profile.
Ideal for high-performance computing. |
virtual-guest
| Tunes the system for maximum performance if it runs on a virtual machine. |
virtual-host
| Tunes the system for maximum performance if it acts as a host for virtual machines. |
intel-sst
| Optimized for systems with Intel Speed Select Technology configurations. Use it as an overlay on other profiles. |
optimize-serial-console
| Increases responsiveness of the serial console. Use it as an overlay on other profiles. |
The tuned application stores the tuning profiles under the /usr/lib/tuned and /etc/tuned directories. Every profile has a separate directory, and inside the directory the tuned.conf main configuration file and, optionally, other files.
[root@host ~]#cd /usr/lib/tuned[root@host tuned]#lsaccelerator-performance hpc-compute network-throughput throughput-performance balanced intel-sst optimize-serial-console virtual-guest desktop latency-performance powersave virtual-host functions network-latency recommend.d [root@host tuned]$ls virtual-guesttuned.conf
A typical tuned.conf configuration file looks as follows:
[root@host tuned]# cat virtual-guest/tuned.conf
#
# tuned configuration
#

[main]
summary=Optimize for running inside a virtual guest
include=throughput-performance

[sysctl]
# If a workload mostly uses anonymous memory and it hits this limit, the entire
# working set is buffered for I/O, and any more write buffering would require
# swapping, so it's time to throttle writes until I/O can catch up.  Workloads
# that mostly use file mappings may be able to use even higher values.
#
# The generator of dirty data starts writeback at this percentage (system default
# is 20%)
vm.dirty_ratio = 30

# Filesystem I/O is usually much more efficient than swapping, so try to keep
# swapping low.  It's usually safe to go even lower than this on systems with
# server-grade storage.
vm.swappiness = 30
The [main] section in the file might include a summary of the tuning profile. This section also accepts the include parameter, for the profile to inherit all the settings from the referenced profile.
This configuration file is useful when creating new tuning profiles, because you can use one of the provided profiles as a basis, and then add or modify the parameters to configure. To create or modify tuning profiles, copy the tuning profile files from the /usr/lib/tuned directory to the /etc/tuned directory and then modify them. If profile directories exist with the same name under the /usr/lib/tuned and /etc/tuned directories, the latter always take precedence. Thus, never directly modify files in the /usr/lib/tuned system directory.
The rest of the sections in the tuned.conf file use the tuning plug-ins to modify parameters in the system. In the previous example, the [sysctl] section modifies the vm.dirty_ratio and vm.swappiness kernel parameters through the sysctl plug-in.
Use the tuned-adm command to change the settings of the tuned daemon. The tuned-adm command queries current settings, lists available profiles, recommends a tuning profile for the system, changes profiles directly, or turns off tuning.
You can identify the currently active tuning profile with the tuned-adm active command.
[root@host ~]# tuned-adm active
Current active profile: virtual-guest
The tuned-adm list command lists all available tuning profiles, including both built-in profiles and the custom-created tuning profiles.
[root@host ~]# tuned-adm list
Available profiles:
- accelerator-performance     - Throughput performance based tuning with ...
- balanced                    - General non-specialized tuned profile
- desktop                     - Optimize for the desktop use-case
- hpc-compute                 - Optimize for HPC compute workloads
- intel-sst                   - Configure for Intel Speed Select Base Frequency
- latency-performance         - Optimize for deterministic performance at ...
- network-latency             - Optimize for deterministic performance at ...
...output omitted...
Current active profile: virtual-guest
Use the tuned-adm profile_info command for information about a given profile.
[root@host ~]$ tuned-adm profile_info network-latency
Profile name:
network-latency

Profile summary:
Optimize for deterministic performance at the cost of increased power consumption, focused on low latency network performance
...output omitted..
If no profile is specified, then the tuned-adm profile_info command shows the information for the active tuning profile:
[root@host ~]$tuned-adm activeCurrent active profile: virtual-guest [root@host ~]$tuned-adm profile_infoProfile name: virtual-guest Profile summary: Optimize for running inside a virtual guest ...output omitted..
Use the tuned-adm profile command to switch to a different active profile that better matches the system's current tuning requirements.profilename
[root@host ~]$tuned-adm profile throughput-performance[root@host ~]$tuned-adm activeCurrent active profile: throughput-performance
The tuned-adm recommend command can recommend a tuning profile for the system. The system uses this mechanism to determine the default profile after its installation.
[root@host ~]$ tuned-adm recommend
virtual-guest
Note
The tuned-adm recommend command bases its recommendation on various system characteristics, including whether the system is a virtual machine and other predefined selected categories during system installation.
To revert the setting changes that the current profile applied, either switch to another profile or deactivate the tuned daemon. Turn off the tuned application tuning activity by using the tuned-adm off command.
[root@host ~]$tuned-adm off[root@host ~]$tuned-adm activeNo current active profile.
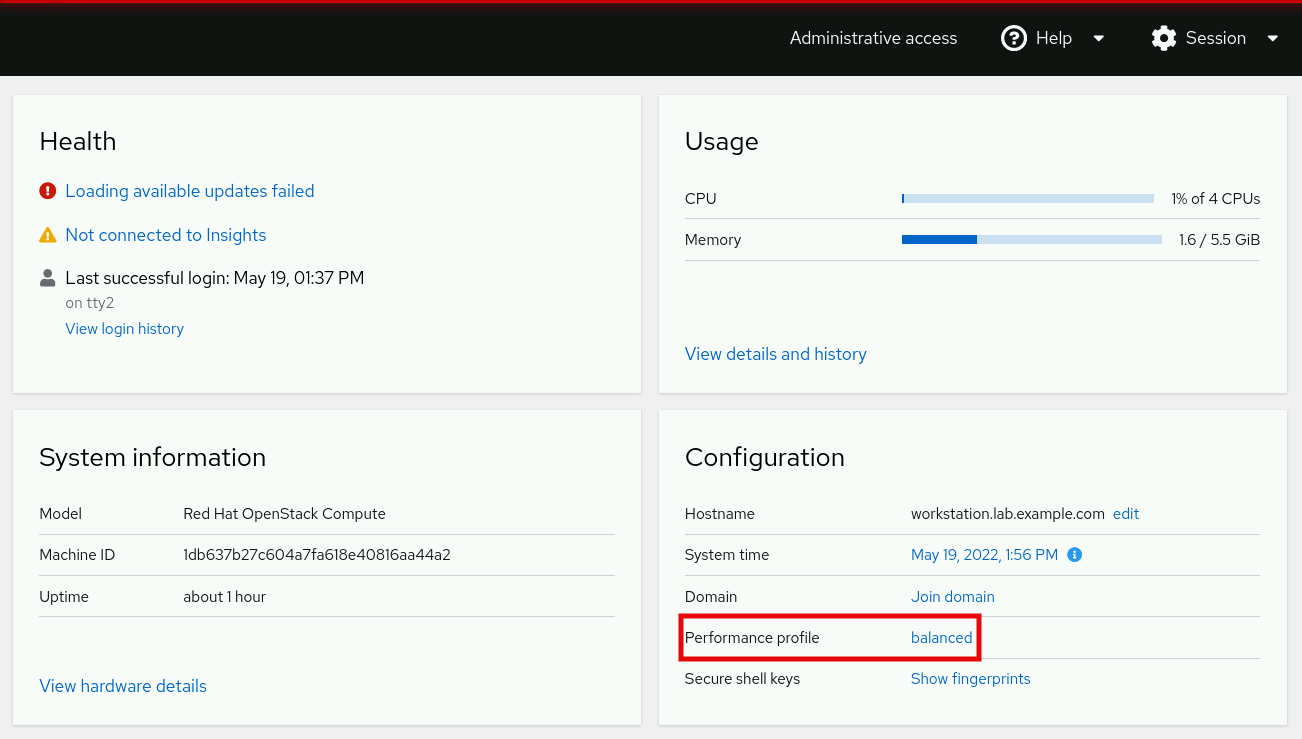
To manage system performance profiles with the web console, you must log in and escalate privileges. Privilege escalation mode permits the user to execute commands, with administrative privileges, that modify system performance profiles. Because changing tuning profiles modifies some system parameters, you must do it with administrative privileges.
You can switch to the administrative access mode in the web console by clicking the or the buttons. Then, enter your password when prompted. After you escalate privileges, the button changes to . As a security reminder, always toggle back to limited access mode after completing the system task that requires administrative privileges.
As a privileged user, click the menu option in the left navigation bar. The field displays the current active profile.
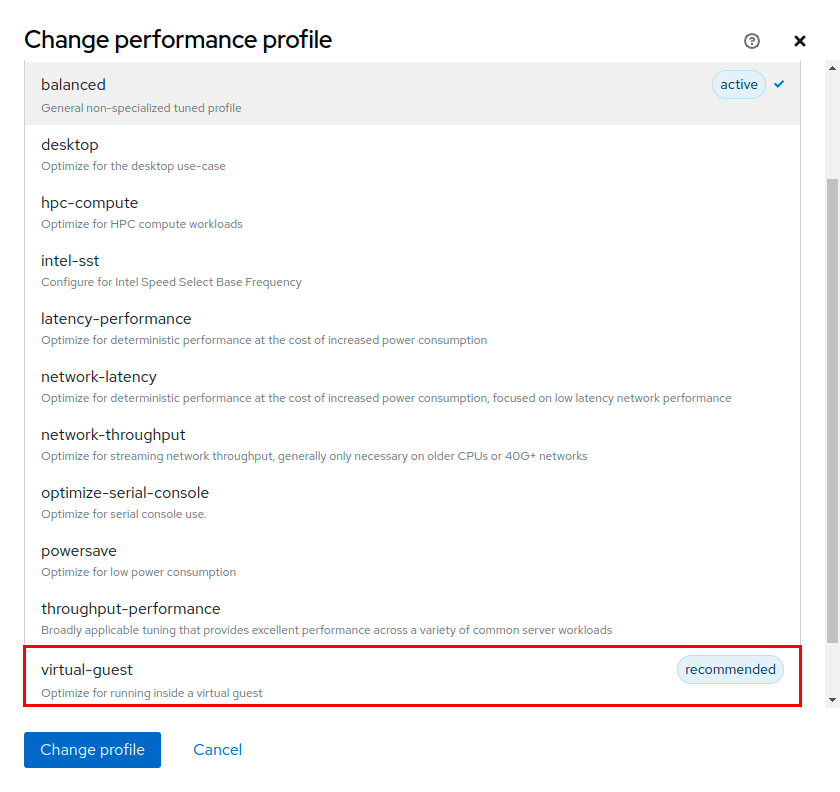
To select a different profile, click the active profile link. In the user interface, scroll through the profile list to select one that best suits the system purpose, and click the button.
To verify changes, return to the main page, and confirm that it displays the active profile in the field.
References
tuned(8), tuned.conf(5), tuned-main.conf(5), and tuned-adm(1) man pages
For more information, refer to the Monitoring and Managing System Status and Performance guide at https://access.redhat.com/documentation/en-us/red_hat_enterprise_linux/9/html-single/monitoring_and_managing_system_status_and_performance/index