Red Hat Enterprise Linux Diagnostics and Troubleshooting
Monitor system performance and record the terminal session of a consultant by using the web console.
Outcomes
You should be able to display current and historical performance indicators on a system and play back a terminal session with the web console.
As the student user on the workstation machine, use the lab command to prepare your system for this exercise.
[student@workstation ~]$ lab start baseline-monitoring
This command confirms that the required hosts for this exercise are accessible and creates the consultant user.
Instructions
In this exercise, you install and configure the web console software on servera. You use web console features to gather current performance statistics of the system. You record the terminal session of a consultant.
Log in to
serveraand switch to therootuser.[student@workstation ~]$
ssh student@servera...output omitted... [student@servera ~]$sudo -i[sudo] password for student:student[root@servera ~]#Install the web console software packages on
servera.cockpit-composercockpit-machinescockpit-pcpcockpit-podmancockpit-session-recordingtlog
[root@servera ~]#
yum install cockpit-composer cockpit-machines cockpit-pcp cockpit-podman cockpit-session-recording tlogRestart the
pmloggerservice to configure persistent logging of performance metrics.[root@servera ~]#
systemctl restart pmloggerStart and enable the web console.
[root@servera ~]#
systemctl enable --now cockpit.socketLog out from the
rootuser and fromservera.[root@servera ~]#
exit[student@servera ~]$logoutConnection to servera closed. [student@workstation ~]$Inspect the system performance status of
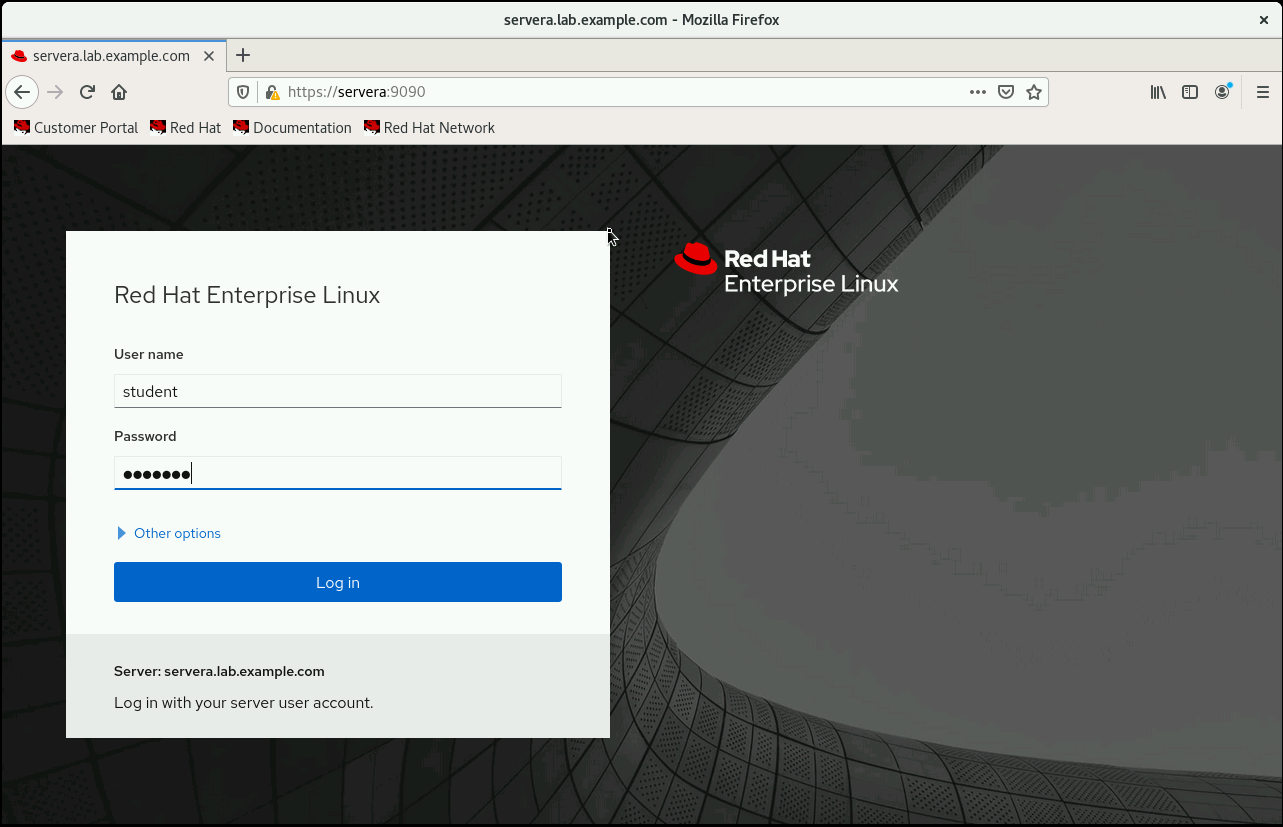
serveraon the web console.On
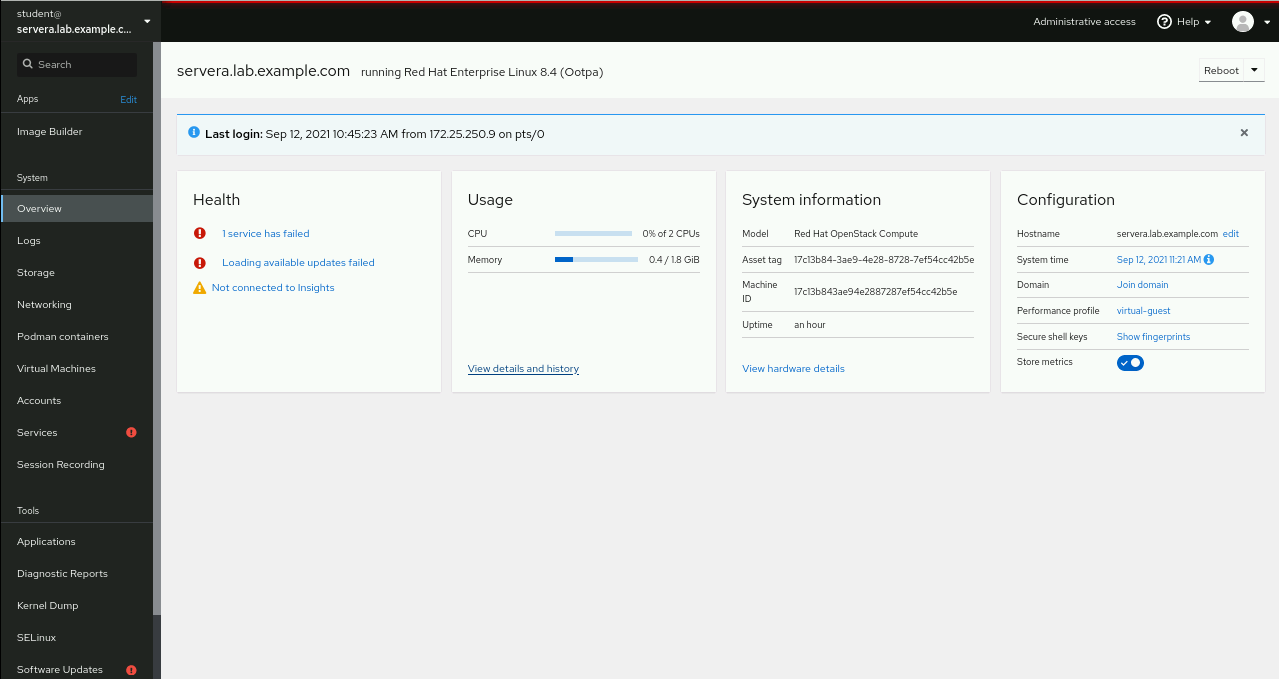
workstation, open a web browser and navigate to https://servera:9090. Accept the certificate warning. Log in with user namestudentand passwordstudent.Review the alerts that are reported in the overview.
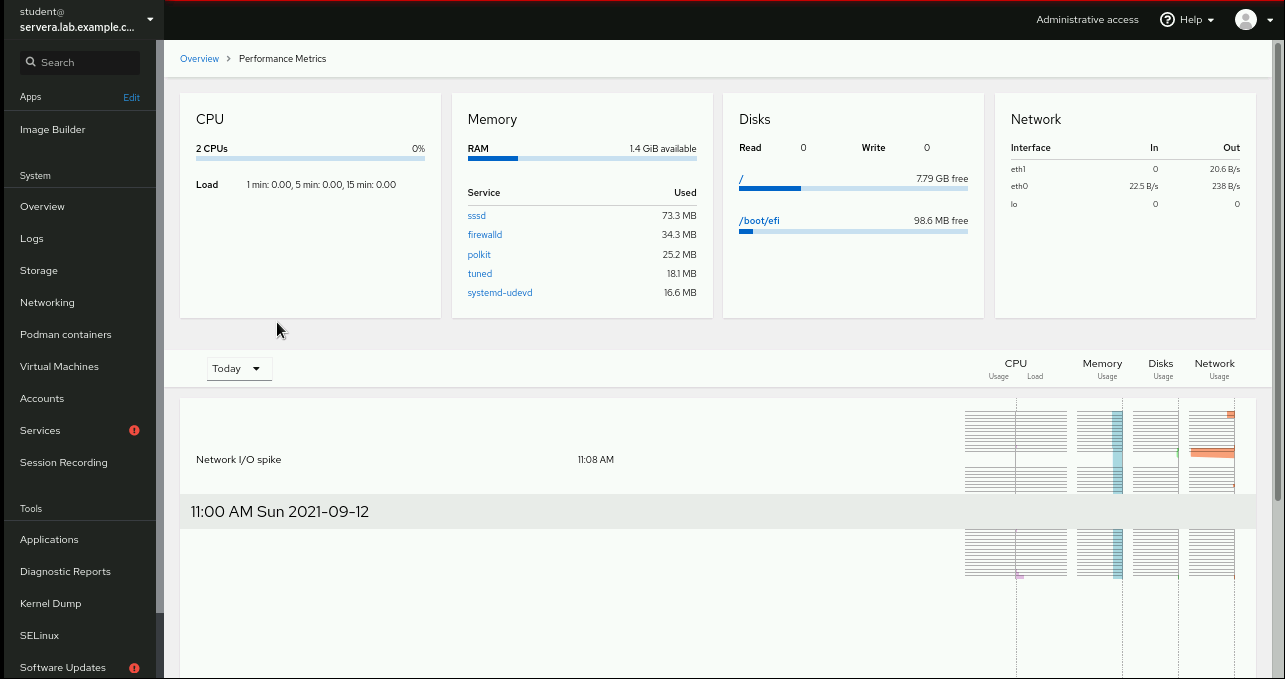
Inspect the historical performance of the system. Click the link in the box.
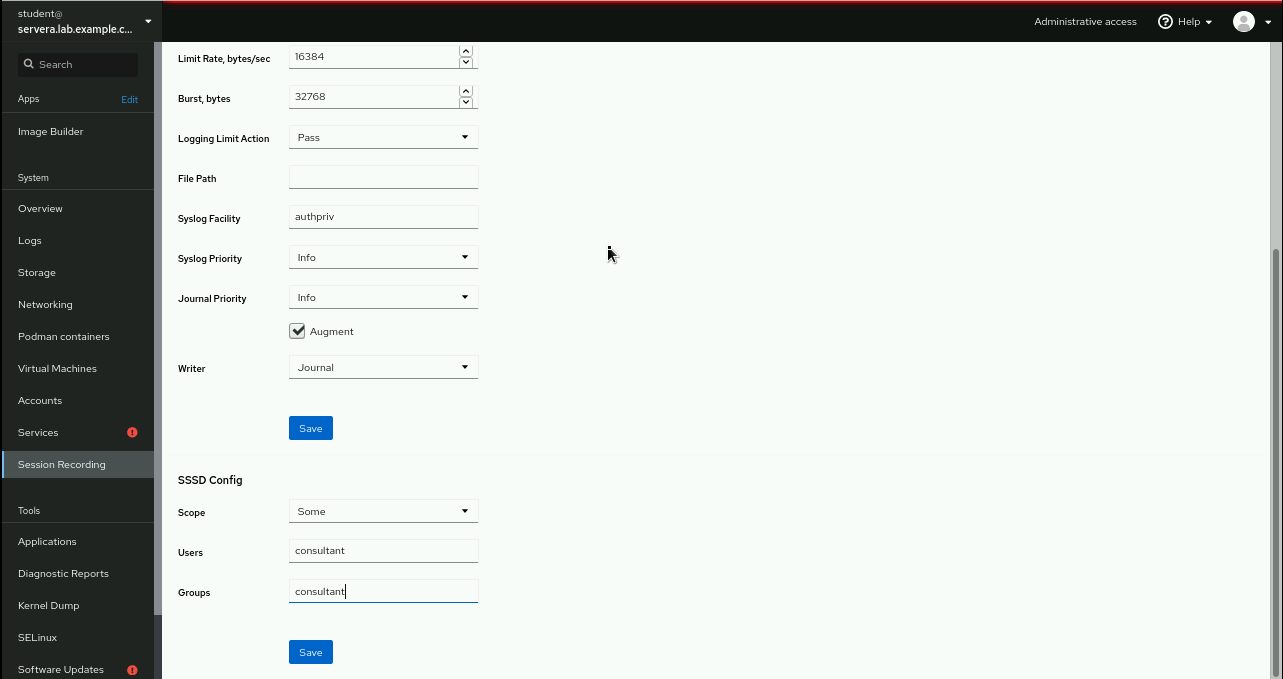
Configure the terminal session recording of the
consultantuser.Click from the main menu, and then click the gear icon. Navigate to and select → , and then define
consultantas and .Click and click at the top of the page.
Log in as the
consultantuser and perform some tasks on theserverahost to be monitored.Open a terminal and log in to
serveraas theconsultantuser.[student@workstation ~]$
ssh consultant@servera[consultant@servera ~]$Run various commands as the
consultantuser.[consultant@servera ~]$
ps auxf...output omitted... [consultant@servera ~]$top...output omitted... [consultant@servera ~]$df -h...output omitted...Return to
workstationasstudent.[consultant@servera ~]$
exit[student@workstation ~]$
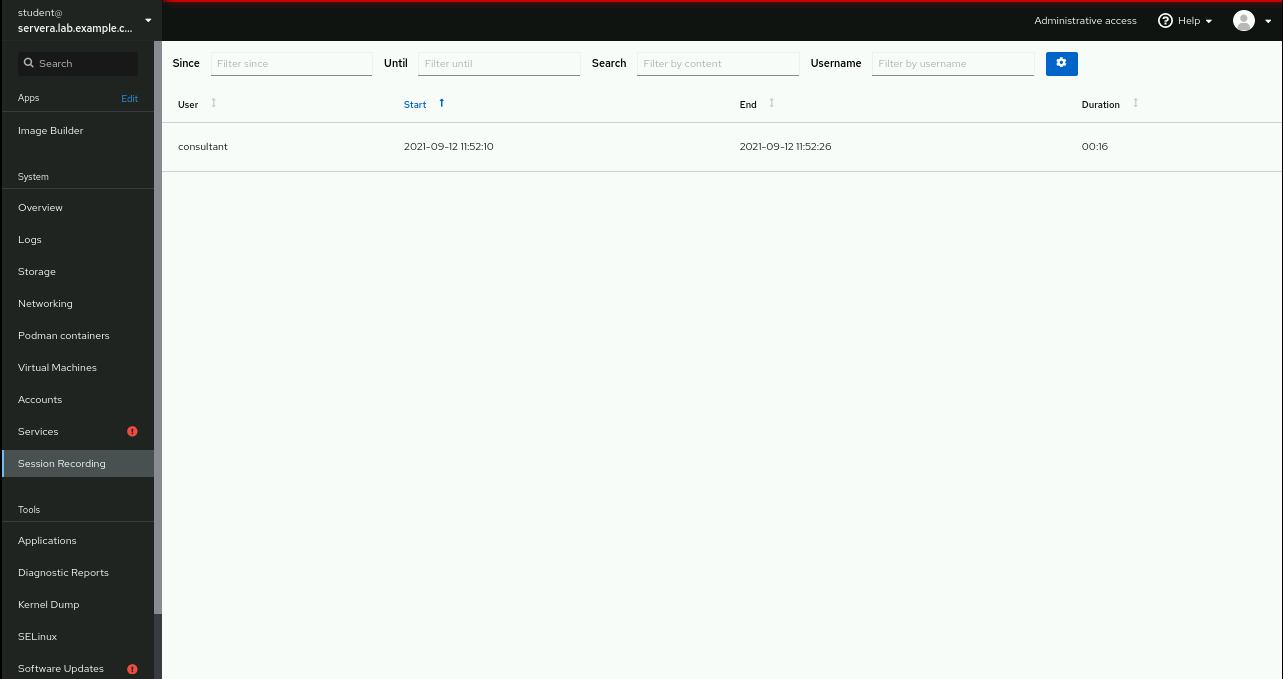
Review the tasks that the
consultantuser performed in the web console.In the web console of
servera, click .Click the recorded terminal session of the
consultantuser.Play back the recorded session. Click .